|
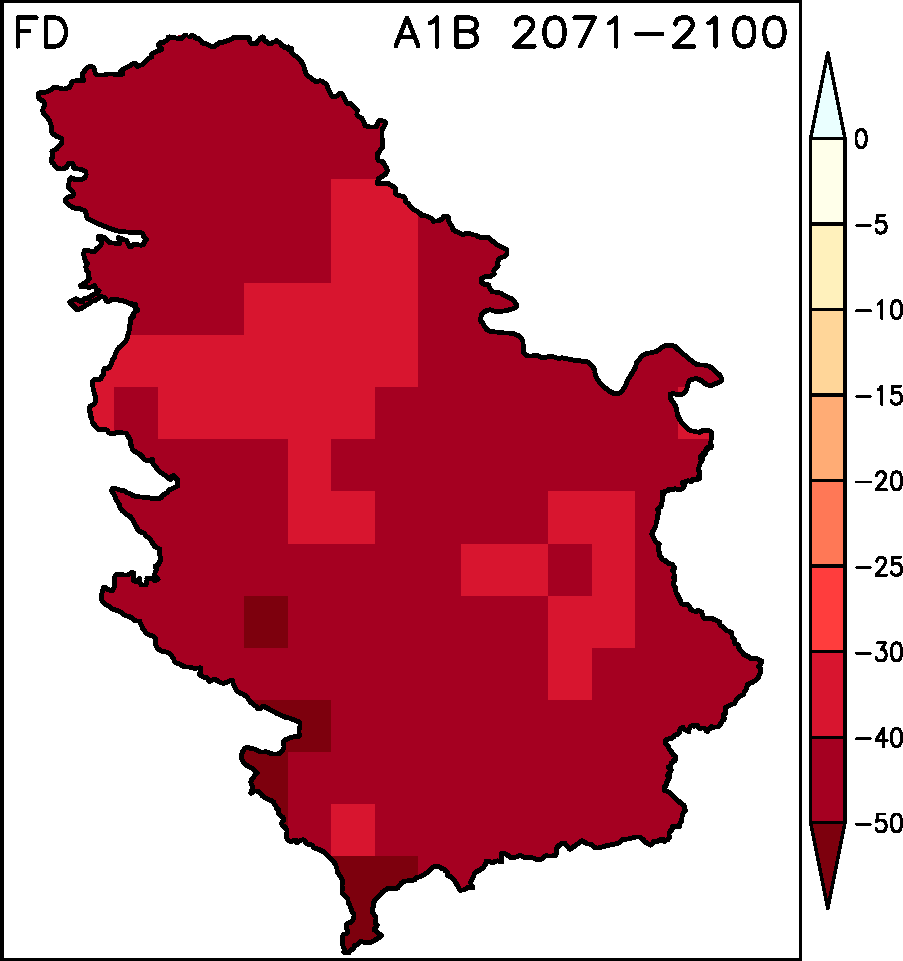
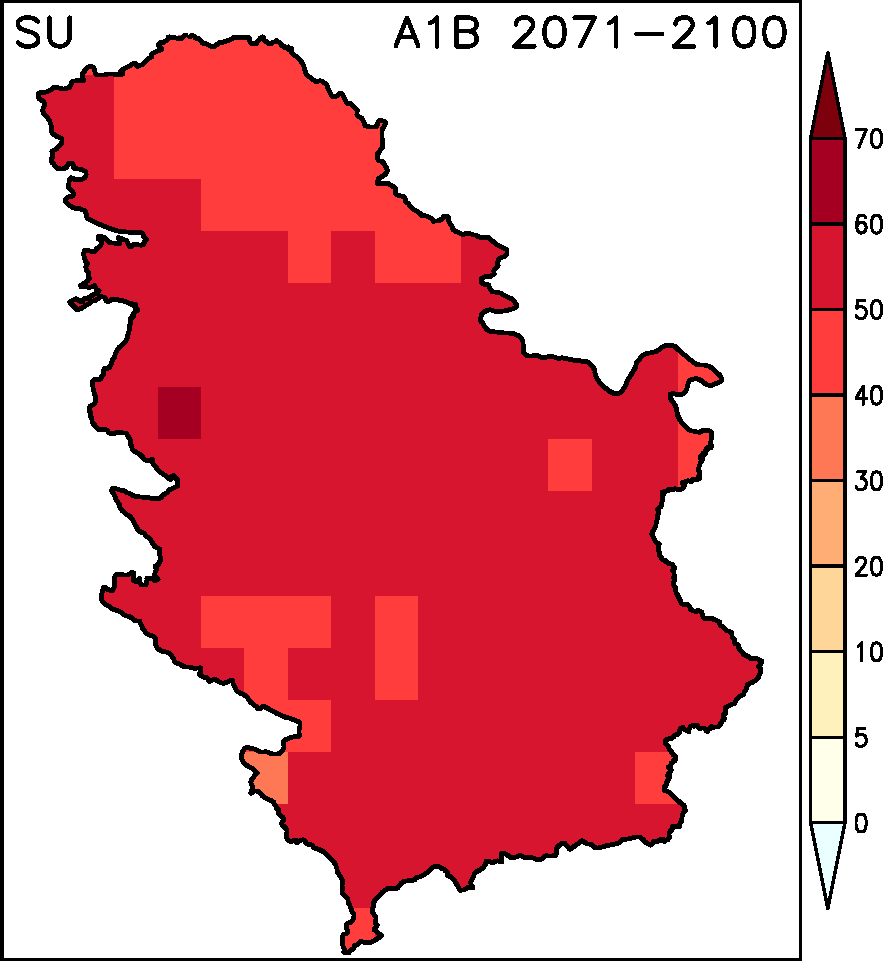
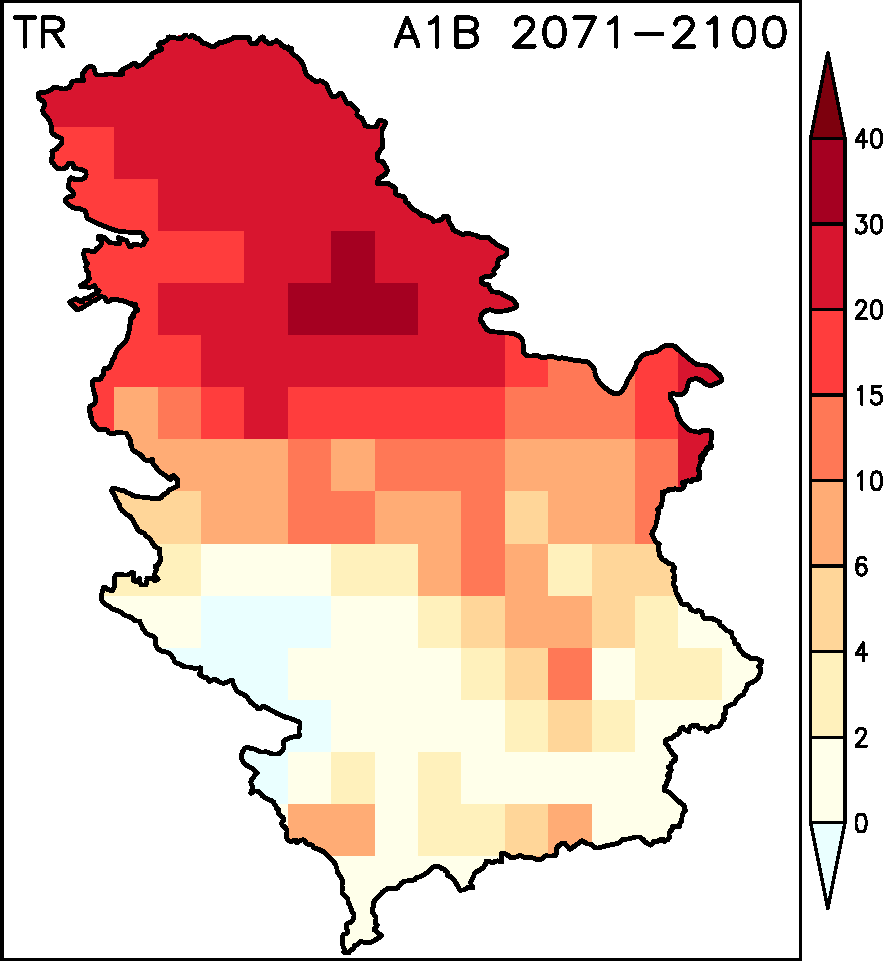
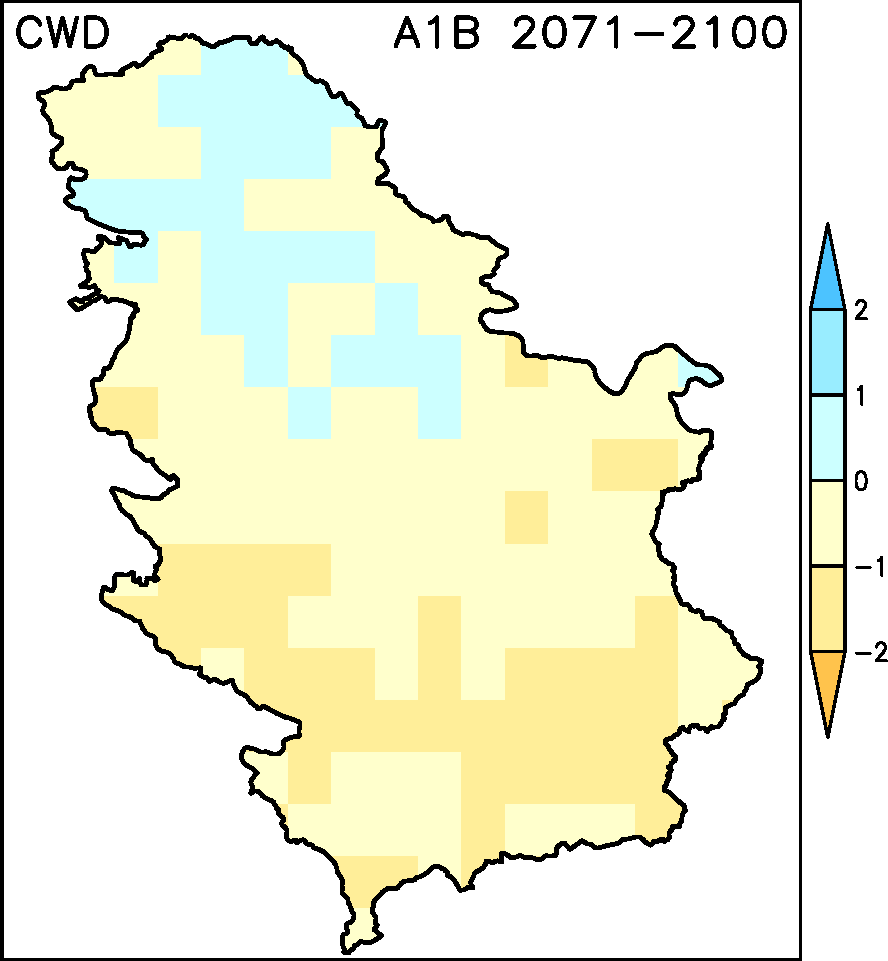
INDICES CHANGE UNDER A1B SCENARIO FOR 2071-2100 PERIOD
Figures for climate indices mean annual change for selected future time slice.
All changes are ploted with recpect to 1961-1990 period.
Click on image for hi-resolution.
| Frost days |
Summer days |
Tropical nights |
 |
 |
 |
| Growing season length |
Consecutive dry days |
Consecutive wet days |
 |
 |
 |
- Figures are plotted using BIAS CORRECTED model data.
|