|
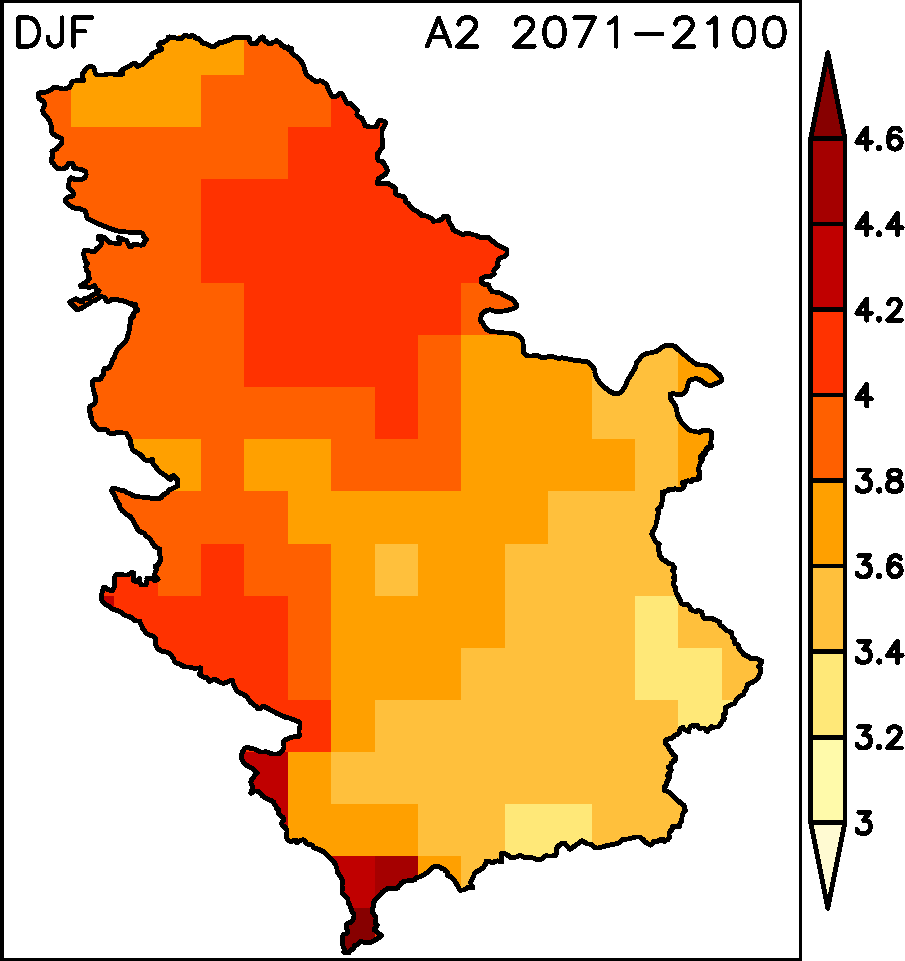
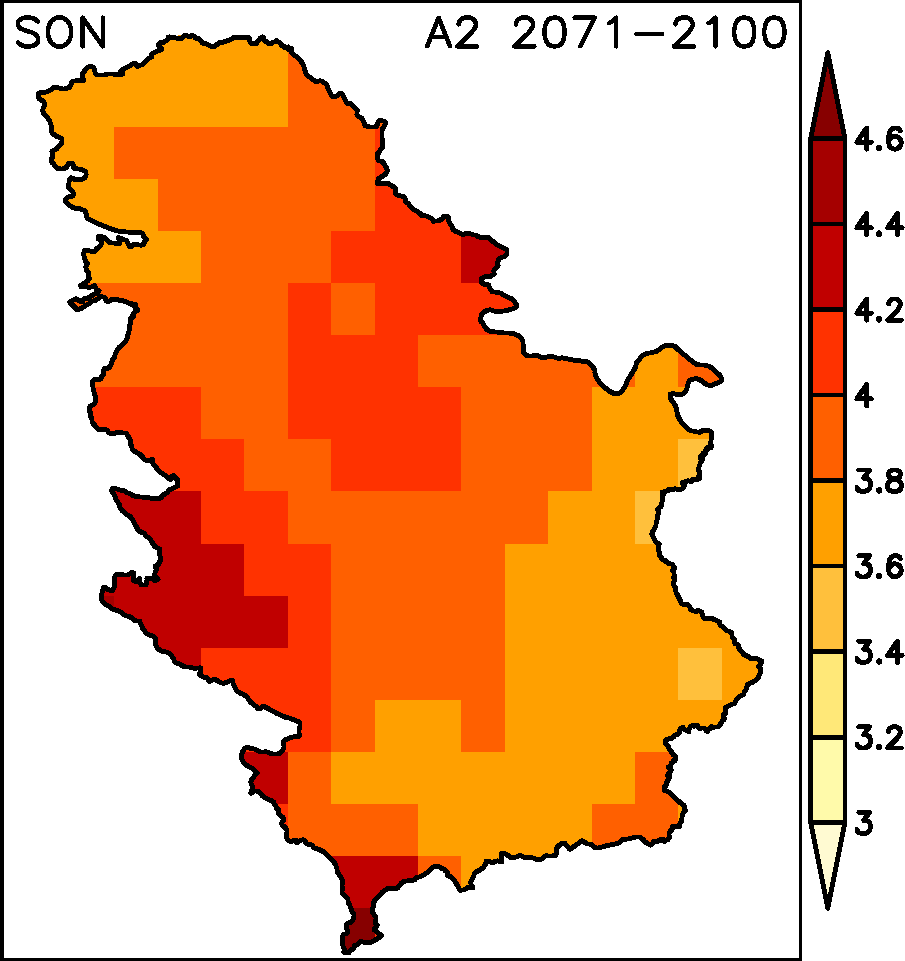
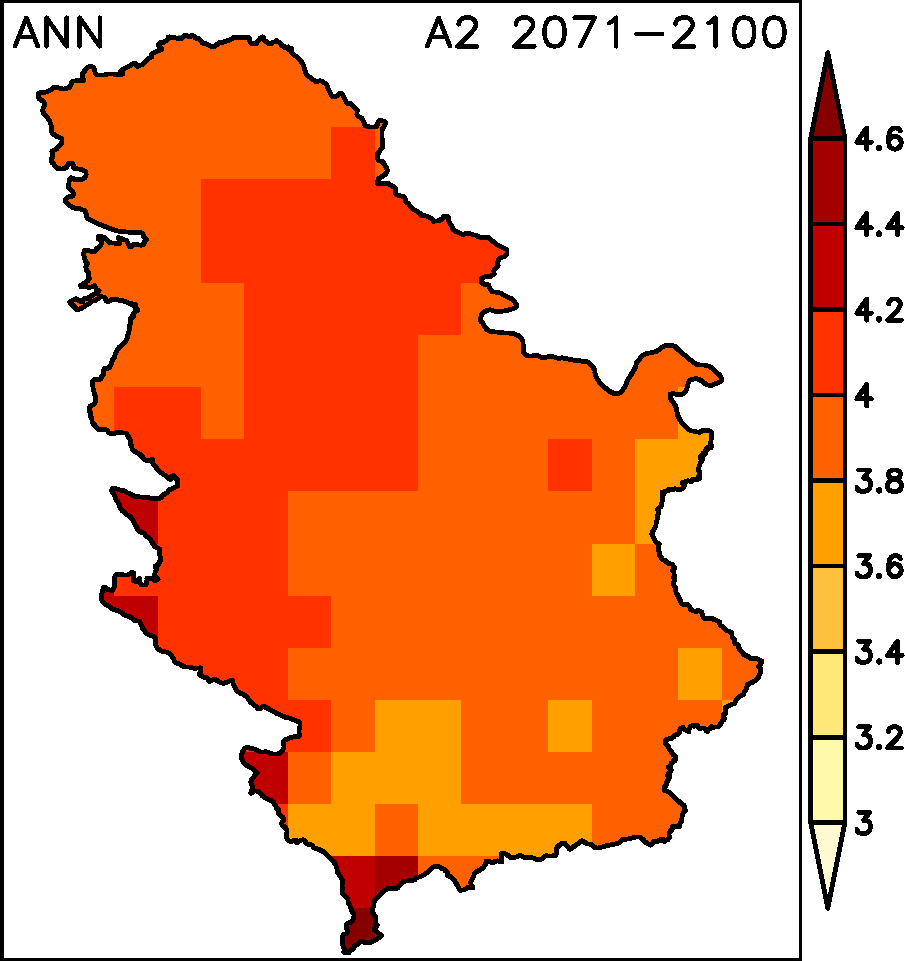
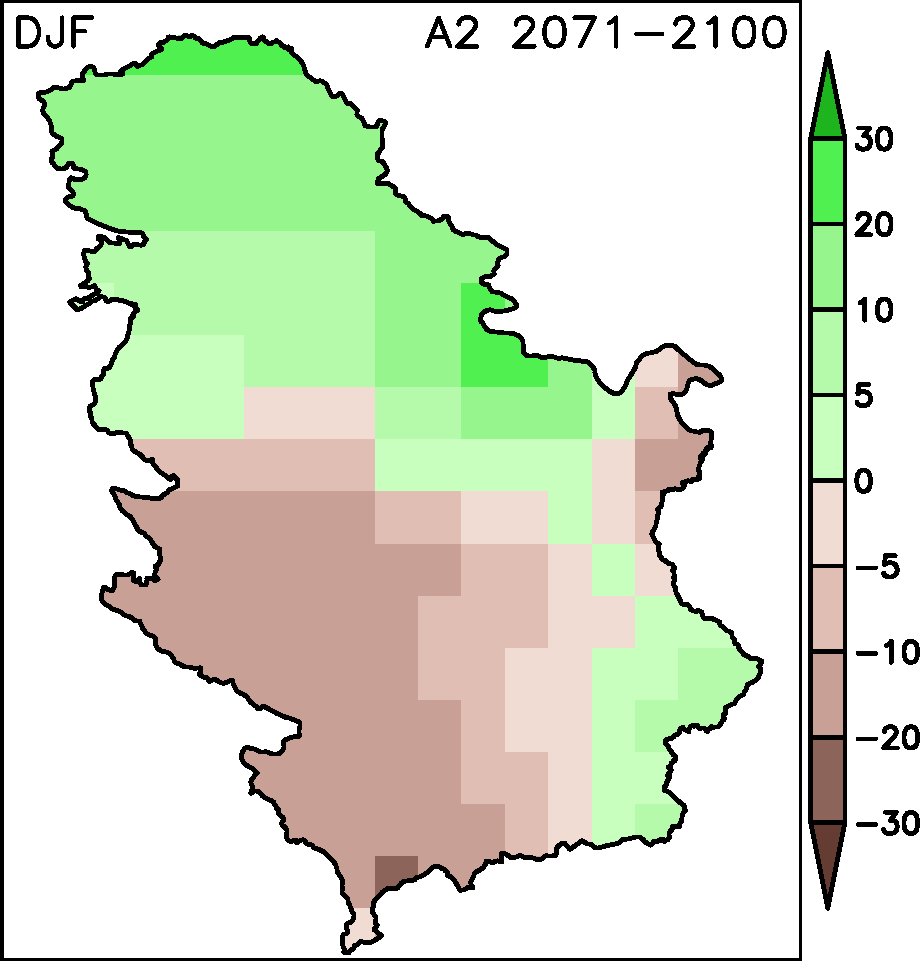
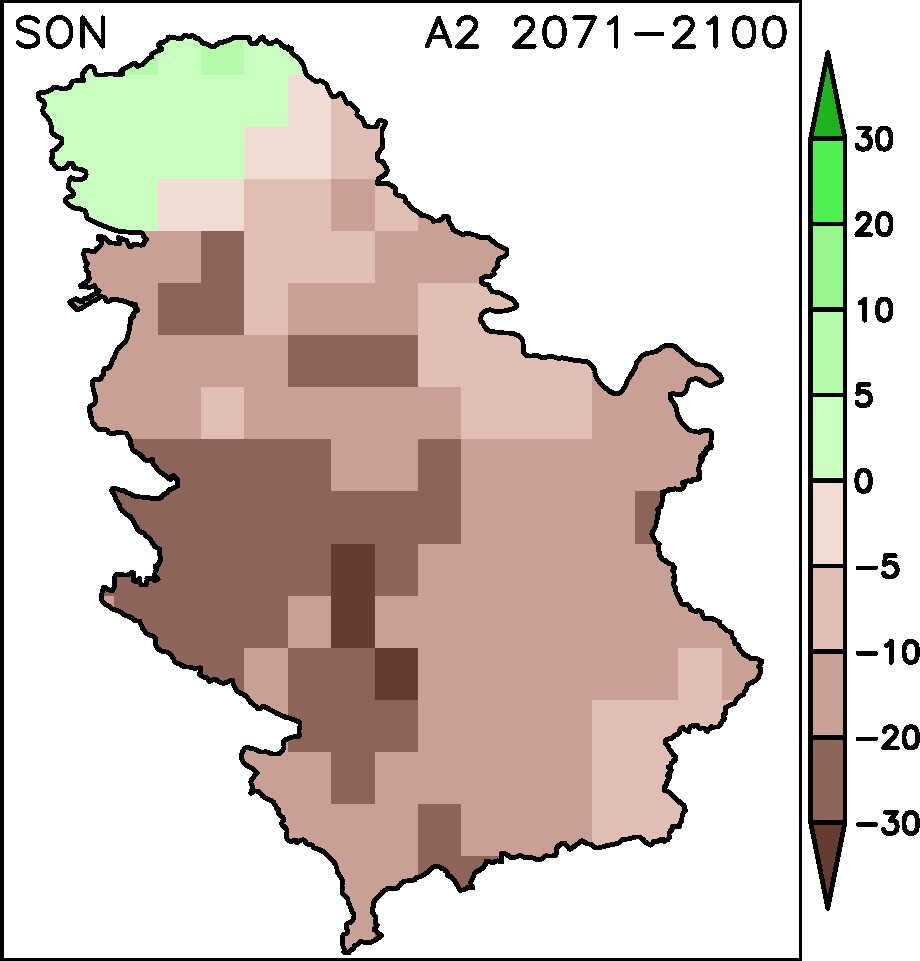
A2 SCENARIO FOR 2071-2100 PERIOD
Figures for seasonal and annual mean temperature and precipitation change for selected future time slice.
All changes are ploted with recpect to 1961-1990 period.
Click on image for hi-resolution.
Temperature change (°C)
| December-January-February |
March-April-May |
Jun-July-August |
September-October-November |
Annual |
 |
 |
 |
 |
 |
Precipitation change (%)
| December-January-February |
March-April-May |
Jun-July-August |
September-October-November |
Annual |
 |
 |
 |
 |
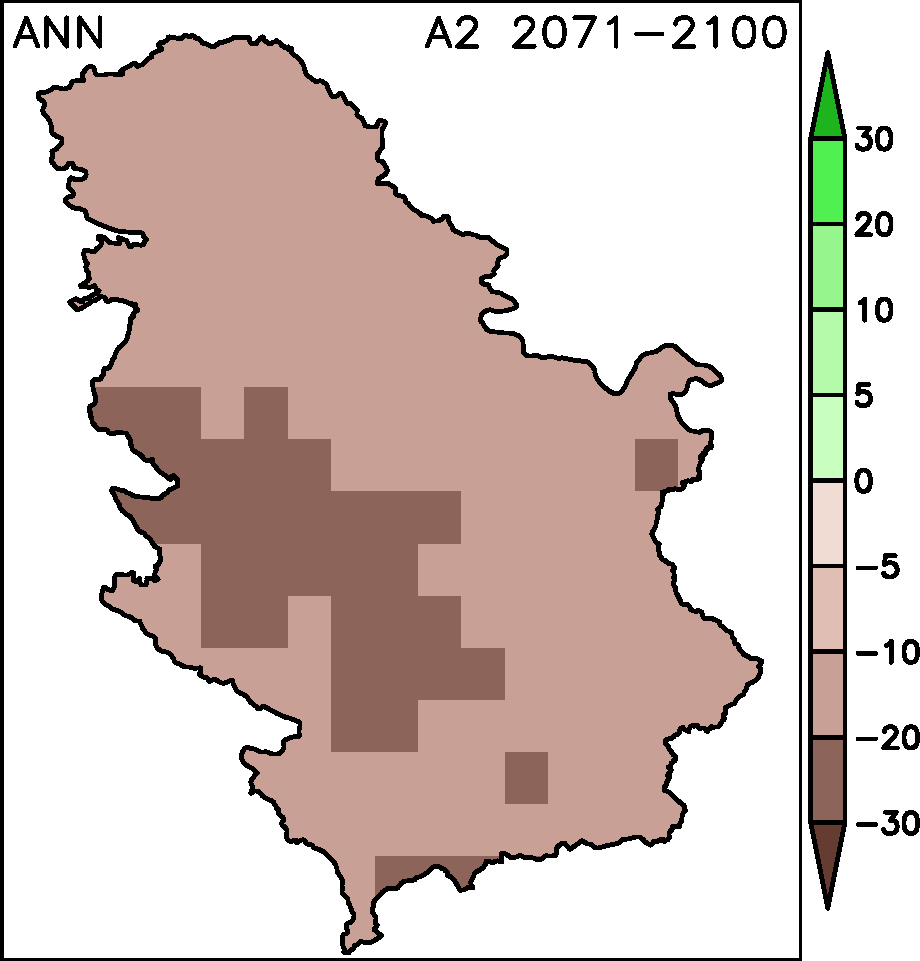 |
- Figures are plotted using BIAS CORRECTED model data.
|